fixed
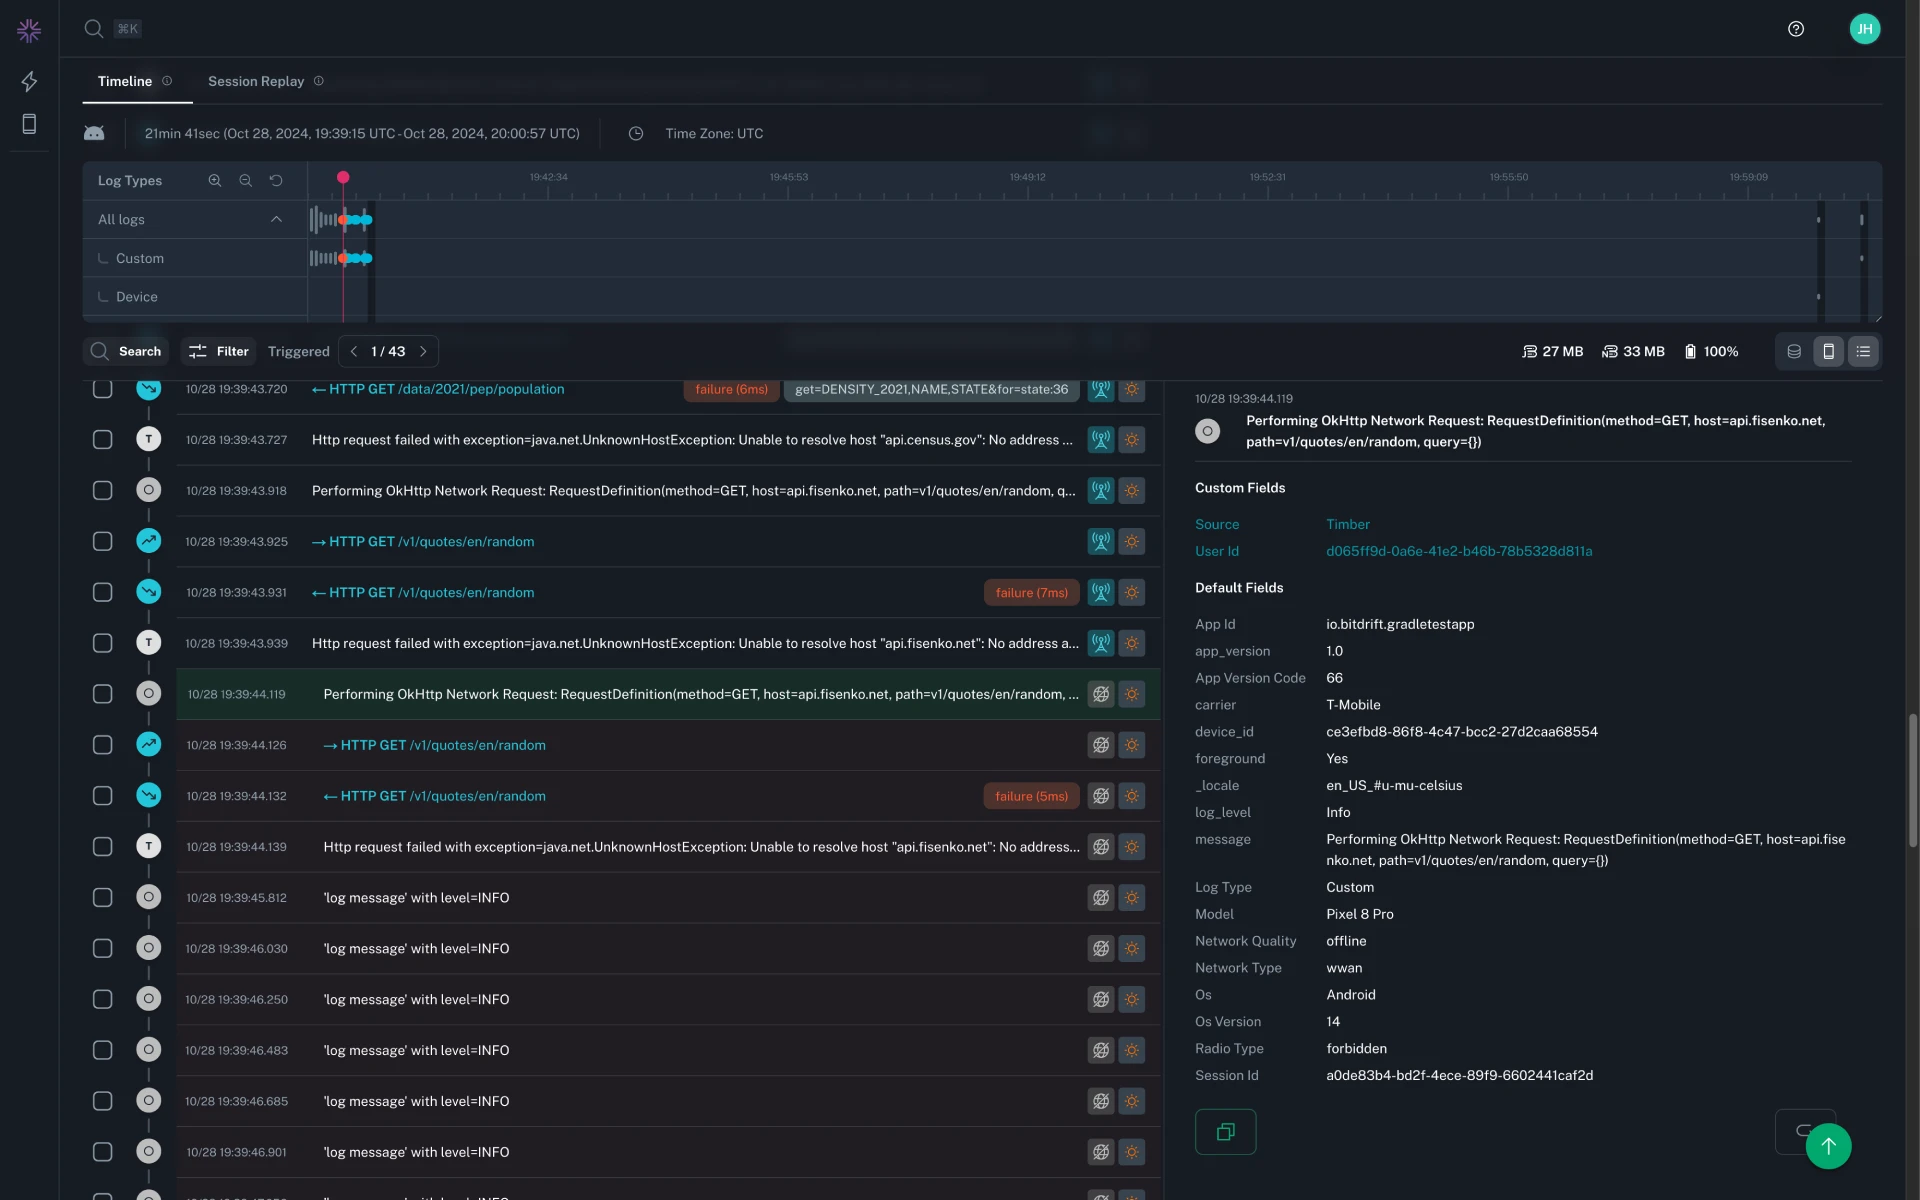

Timeline rows fail more gracefully
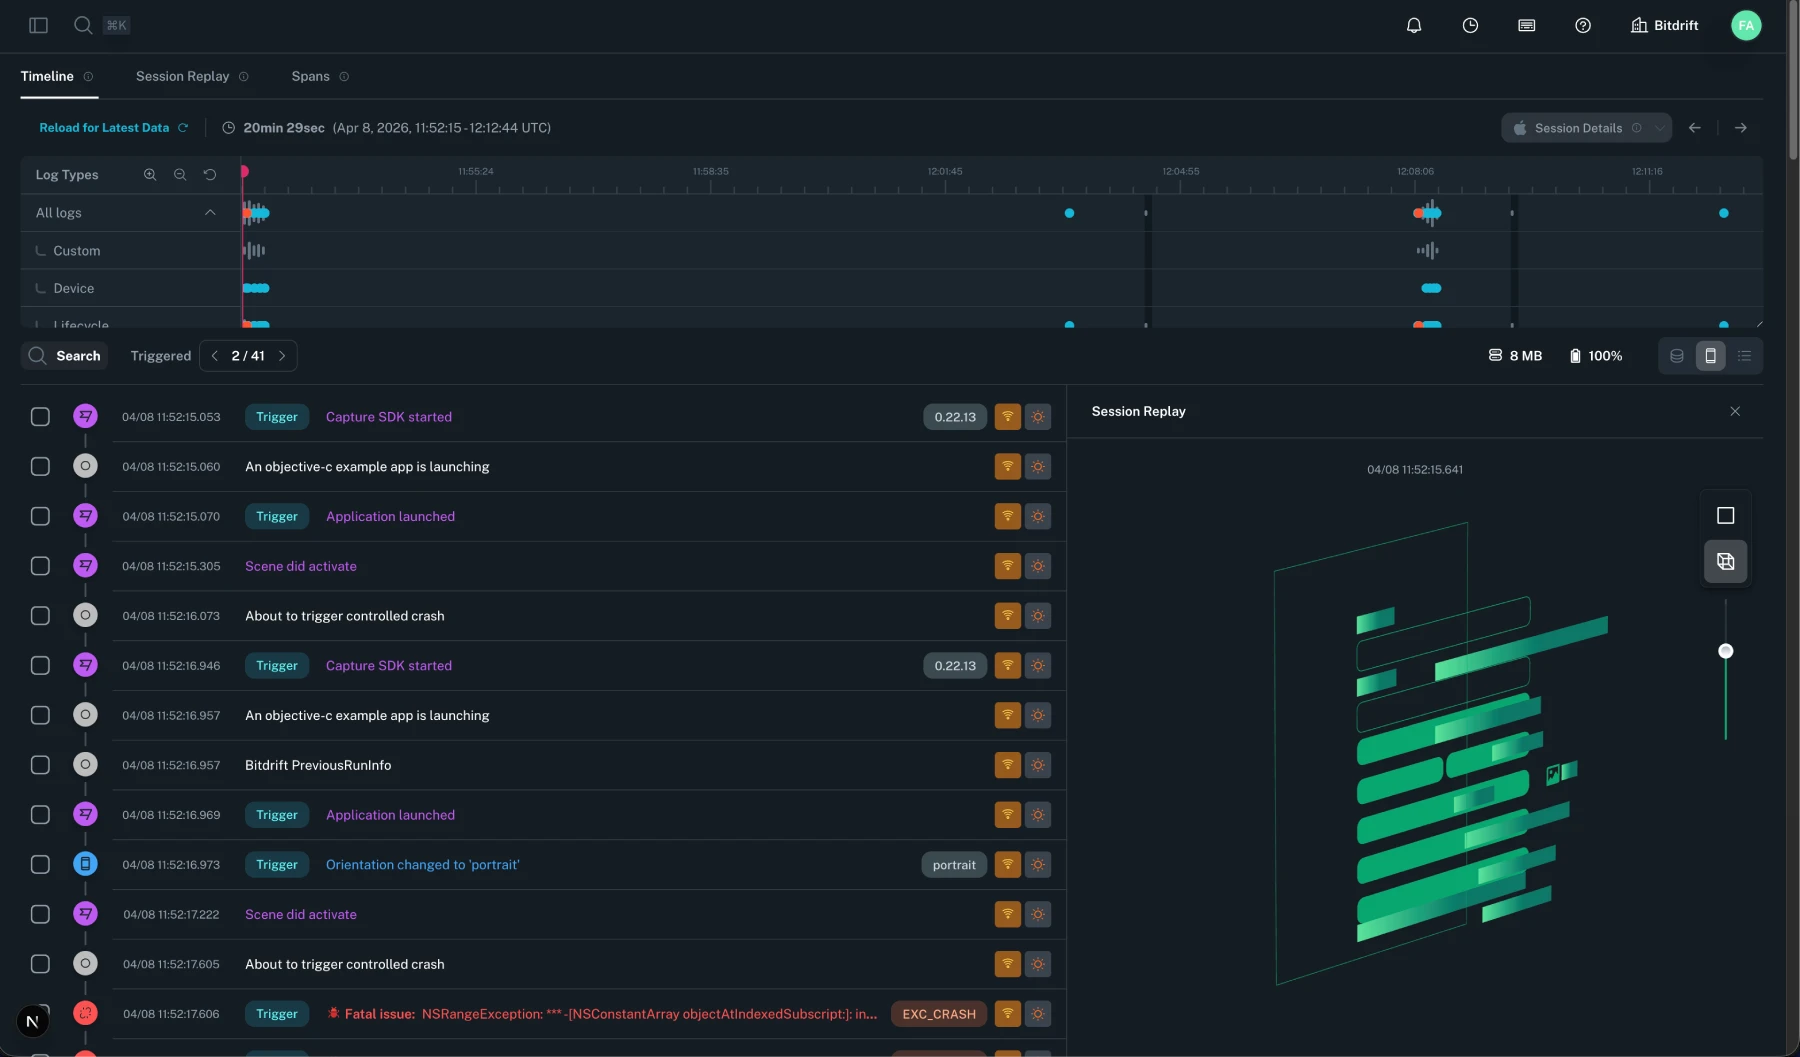
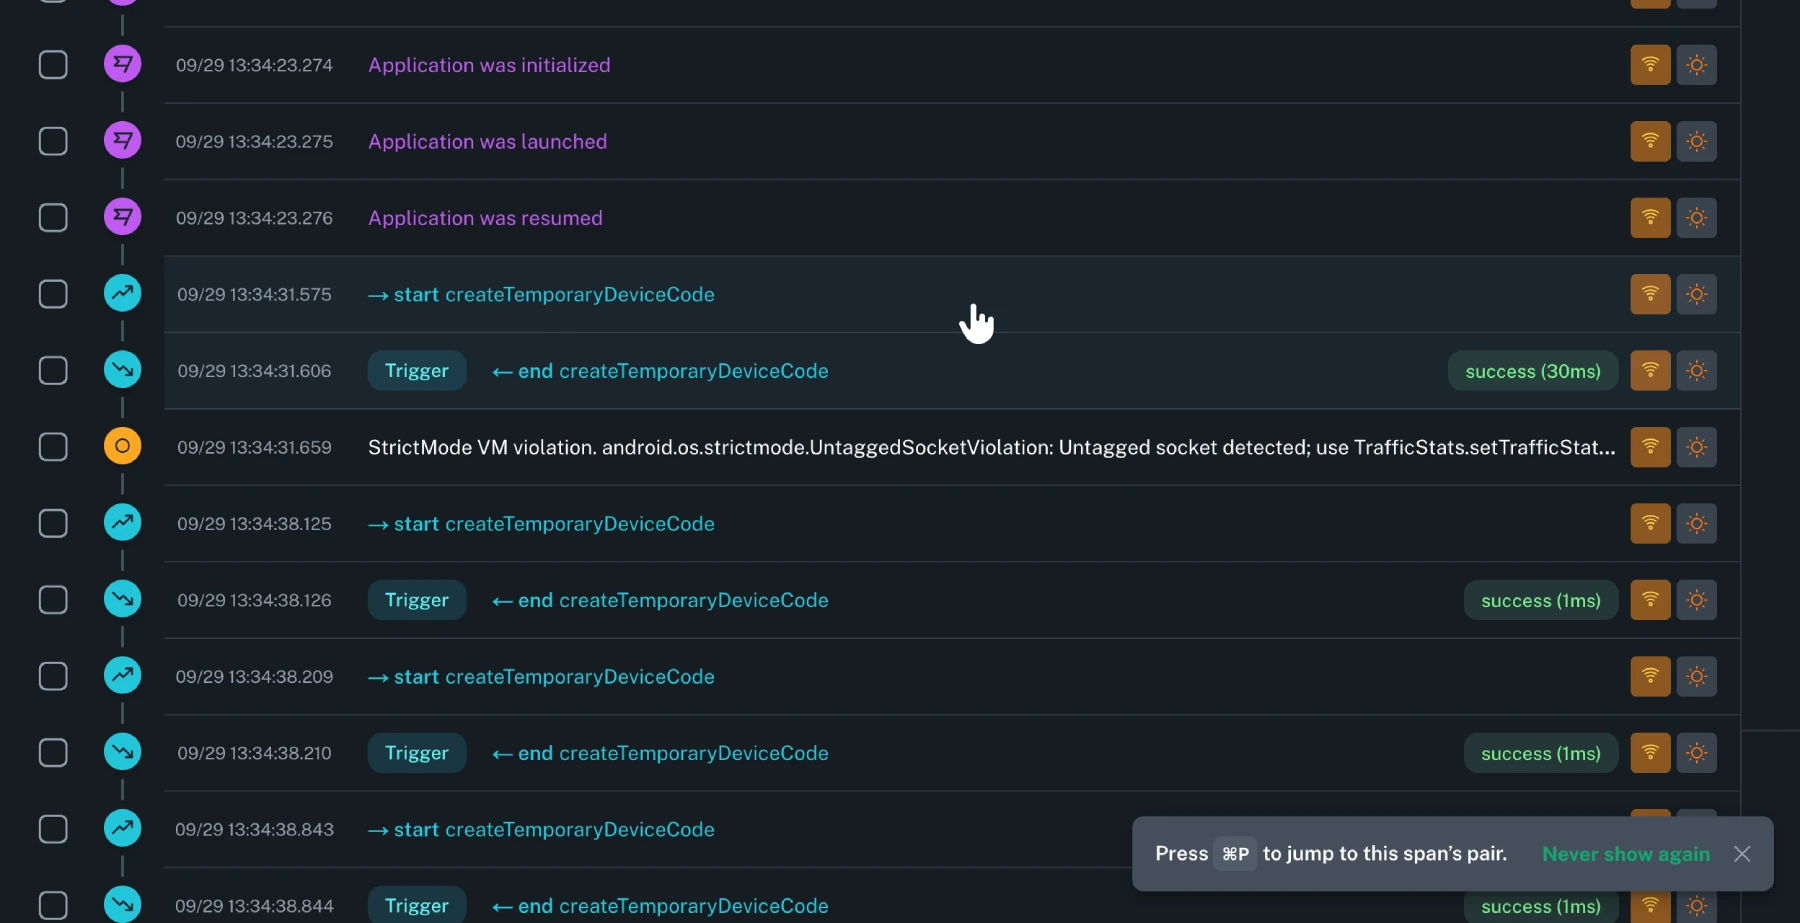
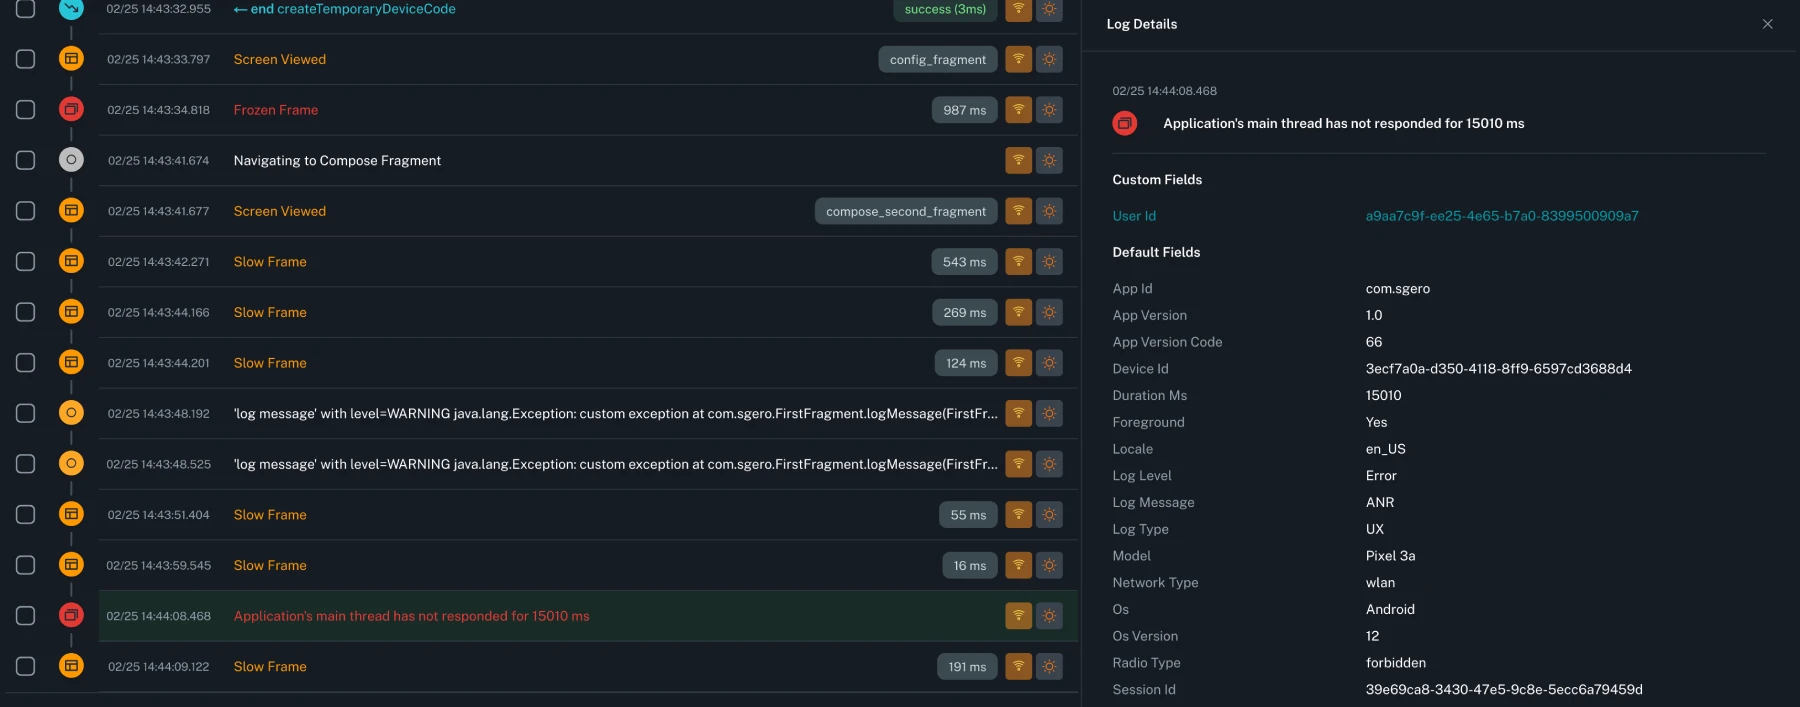
Fixed an issue where a rendering problem in one timeline row could disrupt a larger section of the session view; affected rows now fall back independently so the rest of the timeline stays usable.
fixed
WebView page-view spans keep nested activity visible
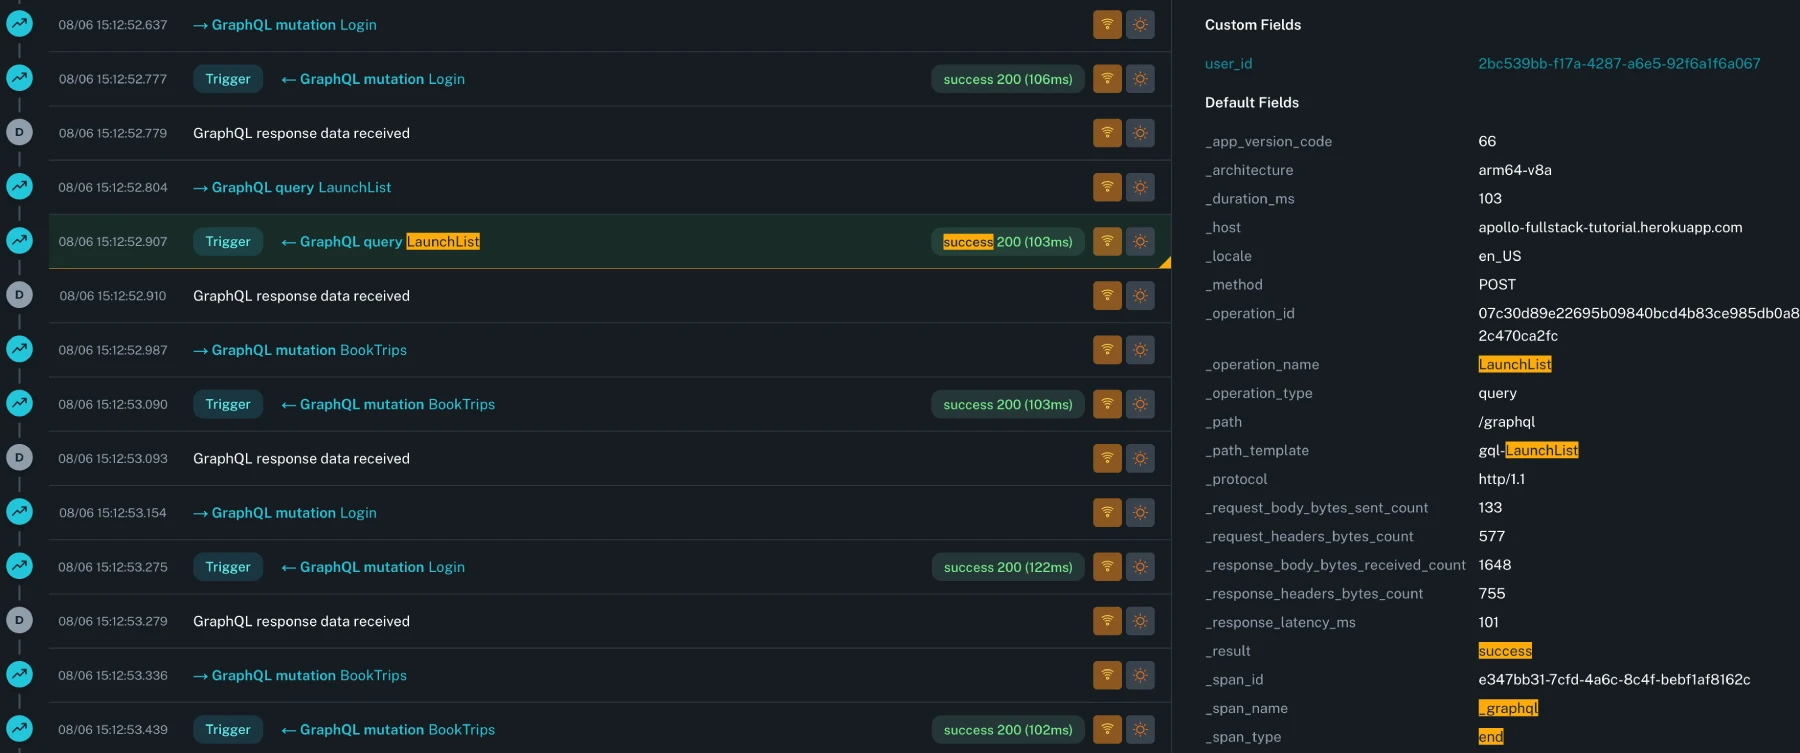
Timeline now treats orphaned WebView page-view spans as roots, opens them with nested activity visible by default, and preserves your collapse state as you focus into a trace.